Visualization Tutorial — Droplet Surface and Contact Angle
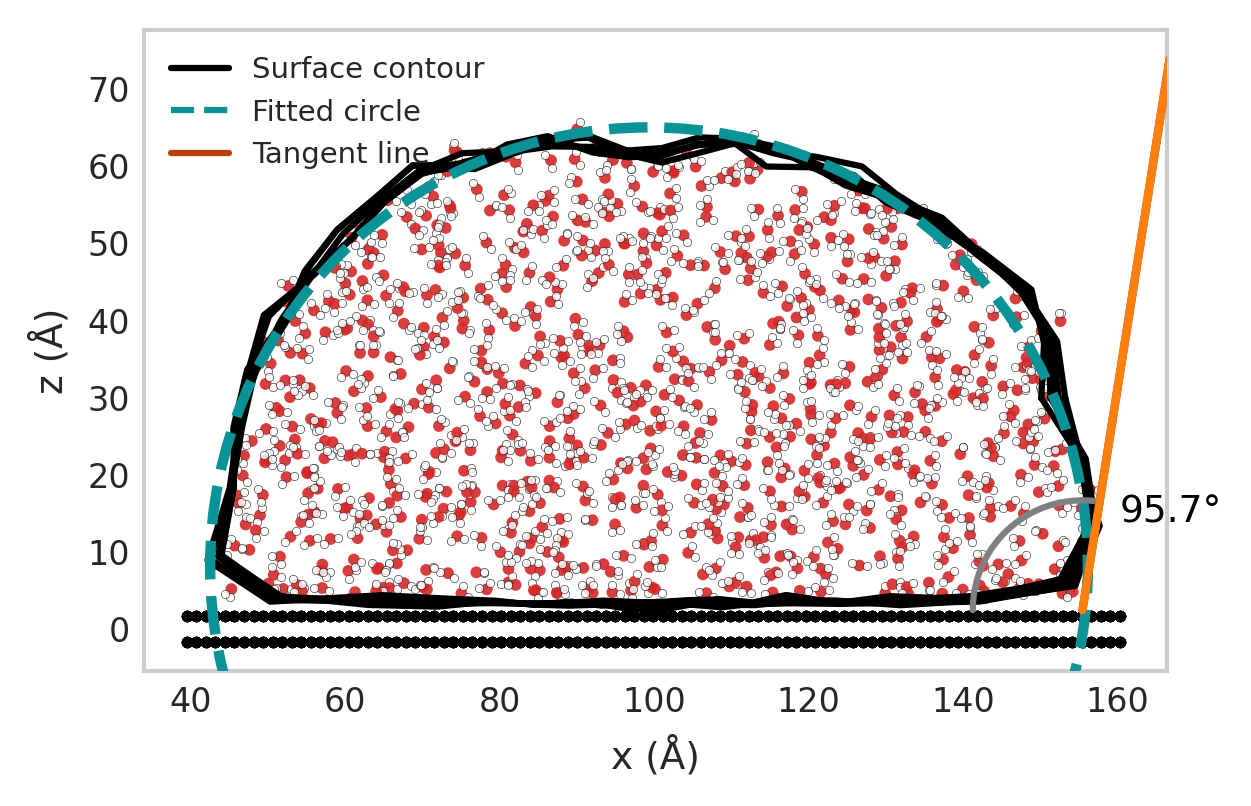
This tutorial demonstrates how to visualize a droplet and compute its contact angle using the HydroAngleAnalyzer package. We’ll use the sliced contact angle method and visualize the resulting droplet with the DropletSlicedPlotter class.
1. Overview
The visualization workflow involves the following steps:
Parse atomic positions from a trajectory file.
Identify water molecules (oxygen and hydrogen atoms).
Compute the droplet surface and contact angle using the sliced method.
Visualize the droplet, fitted circle, tangent, and wall.
2. Import Required Modules
import numpy as np
from hydroangleanalyzer.parser import (
    DumpParser,
    DumpWaterMoleculeFinder,
    DumpWallParser,
)
from hydroangleanalyzer.contact_angle_method.sliced_method import ContactAngleSliced
from hydroangleanalyzer.visualization_angles import DropletSlicedPlotter
3. Define the Input Trajectory
filename = (
    "../HydroAngleAnalyzer/tests/trajectories/traj_10_3_330w_nve_4k_reajust.lammpstrj"
)
4. Identify Water Molecules
wat_find = DumpWaterMoleculeFinder(
    filename, particle_type_wall={3}, oxygen_type=1, hydrogen_type=2
)

oxygen_indices = wat_find.get_water_oxygen_ids(frame_index=0)
print("Number of water molecules detected:", len(oxygen_indices))
5. Parse Atomic Coordinates
parser = DumpParser(filepath=filename)
oxygen_position = parser.parse(frame_index=10, indices=oxygen_indices)

coord_wall = DumpWallParser(filename, particule_liquid_type={1, 2})
wall_coords = coord_wall.parse(frame_index=1)
6. Compute Contact Angles
processor = ContactAngleSliced(
    liquid_coordinates=oxygen_position,
    liquid_geom_center=np.mean(oxygen_position, axis=0),
    droplet_geometry="cylinder_y",
    delta_cylinder=5,
    max_dist=100,
    width_cylinder=21,
)

list_alfas, array_surfaces, array_popt = processor.predict_contact_angle()
print("Mean contact angles (°):", list_alfas)
7. Visualize the Droplet
plotter = DropletSlicedPlotter(center=True, show_wall=True, molecule_view=True)

plotter.plot_surface_points(
    oxygen_position=oxygen_position,
    surface_data=array_surfaces,
    popt=array_popt[0],
    wall_coords=wall_coords,
    output_filename="droplet_plot.png",
    alpha=list_alfas[0],
)

print(" Plot saved as 'droplet_plot.png'")
Outputs